Zabbix Agent 2 を使ってみたところ、従来の Agent と比較し StatusPort という項目が増えていたのですが、何ができるのかなどの情報が見つからなかったので確認してみました。
StatusPort
The port agent 2 will be listening on for HTTP status request and display of a list of configured plugins and some internal parameters
確認環境
下記のバージョンで確認しました。
- Zabbix Agent 2 v5.0.3
- Linux 版:CentOS 8.2 上の Docker
- Windows 版:Windows 10
設定方法
設定ファイルにこのような項目があり、デフォルトでは設定されていないポート番号を設定した上で Agent 2 を起動します。
### Option: StatusPort
#	Agent will listen on this port for HTTP status requests.
#
# Mandatory: no
# Range: 1024-32767
# Default:
# StatusPort=
http://(IPアドレス):(StatusPort)/status にアクセスします。/だと404になります。
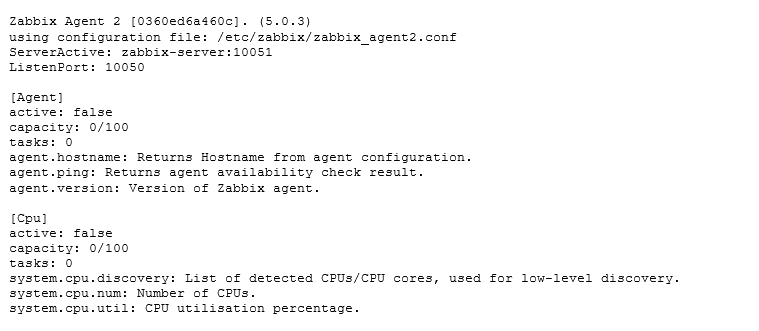
Linux 版
Zabbix Agent 2 [0360ed6a460c]. (5.0.3)
using configuration file: /etc/zabbix/zabbix_agent2.conf
ServerActive: zabbix-server:10051
ListenPort: 10050

[Agent]
active: false
capacity: 0/100
tasks: 0
agent.hostname: Returns Hostname from agent configuration.
agent.ping: Returns agent availability check result.
agent.version: Version of Zabbix agent.

[Cpu]
active: false
capacity: 0/100
tasks: 0
system.cpu.discovery: List of detected CPUs/CPU cores, used for low-level discovery.
system.cpu.num: Number of CPUs.
system.cpu.util: CPU utilisation percentage.

[Docker]
active: false
capacity: 0/100
tasks: 0
docker.container_info: Return low-level information about a container.
docker.container_stats: Returns near realtime stats for a given container.
docker.containers: Returns a list of containers.
docker.containers.discovery: Returns a list of containers, used for low-level discovery.
docker.data_usage: Returns information about current data usage.
docker.images: Returns a list of images.
docker.images.discovery: Returns a list of images, used for low-level discovery.
docker.info: Returns information about the docker server.
docker.ping: Pings the server and returns 0 or 1.

[File]
active: false
capacity: 0/100
tasks: 0
vfs.file.cksum: Returns File checksum, calculated by the UNIX cksum algorithm.
vfs.file.contents: Retrieves contents of the file.
vfs.file.exists: Returns if file exists or not.
vfs.file.md5sum: Returns MD5 checksum of file.
vfs.file.regexp: Find string in a file.
vfs.file.regmatch: Find string in a file.
vfs.file.size: Returns file size.
vfs.file.time: Returns file time information.

[Kernel]
active: false
capacity: 0/100
tasks: 0
kernel.maxfiles: Returns maximum number of opened files supported by OS.
kernel.maxproc: Returns maximum number of processes supported by OS.

[Log]
active: false
capacity: 0/100
tasks: 0
log: Log file monitoring.
log.count: Count of matched lines in log file monitoring.
logrt: Log file monitoring with log rotation support.
logrt.count: Count of matched lines in log file monitoring with log rotation support.

[Memcached]
active: false
capacity: 0/100
tasks: 0
memcached.ping: Test if connection is alive or not.
memcached.stats: Returns output of stats command.

[Mysql]
active: false
capacity: 0/100
tasks: 0
mysql.db.discovery: Databases discovery.
mysql.db.size: Database size in bytes.
mysql.get_status_variables: Values of global status variables.
mysql.ping: If the DBMS responds it returns '1', and '0' otherwise.
mysql.replication.discovery: Replication discovery.
mysql.replication.get_slave_status: Replication status.
mysql.version: MySQL version.

[NetIf]
active: false
capacity: 0/100
tasks: 0
net.if.collisions: Returns number of out-of-window collisions.
net.if.discovery: Returns list of network interfaces. Used for low-level discovery.
net.if.in: Returns incoming traffic statistics on network interface.
net.if.out: Returns outgoing traffic statistics on network interface.
net.if.total: Returns sum of incoming and outgoing traffic statistics on network interface.

[Postgres]
active: false
capacity: 0/100
tasks: 0
pgsql.archive: Returns info about size of archive files.
pgsql.autovacuum.count: Returns count of autovacuum workers.
pgsql.bgwriter: Returns JSON for sum of each type of bgwriter statistic.
pgsql.cache.hit: Returns cache hit percent.
pgsql.connections: Returns JSON for sum of each type of connection.
pgsql.db.age: Returns age for each database.
pgsql.db.bloating_tables: Returns percent of bloating tables for each database.
pgsql.db.discovery: Returns JSON discovery rule with names of databases.
pgsql.db.size: Returns size for each database.
pgsql.dbstat: Returns JSON for sum of each type of statistic.
pgsql.dbstat.sum: Returns JSON for sum of each type of statistic for all database.
pgsql.locks: Returns collect all metrics from pg_locks.
pgsql.oldest.xid: Returns age of oldest xid.
pgsql.ping: Test if connection is alive or not.
pgsql.replication.count: Returns number of standby servers.
pgsql.replication.lag.b: Returns replication lag with Master in byte.
pgsql.replication.lag.sec: Returns replication lag with Master in seconds.
pgsql.replication.master.discovery.application_name: Returns JSON discovery with application name from pg_stat_replication.
pgsql.replication.recovery_role: Returns postgreSQL recovery role.
pgsql.replication.status: Returns postgreSQL replication status.
pgsql.uptime: Returns uptime.
pgsql.wal.stat: Returns JSON wal by type.

[Proc]
active: false
capacity: 0/100
tasks: 0
proc.cpu.util: Process CPU utilisation percentage.

[Redis]
active: false
capacity: 0/100
tasks: 0
redis.config: Returns configuration parameters of Redis server.
redis.info: Returns output of INFO command.
redis.ping: Test if connection is alive or not.
redis.slowlog.count: Returns the number of slow log entries since Redis has been started.

[SystemRun]
active: false
capacity: 0/100
tasks: 0
system.run: Run specified command.

[Systemd]
active: false
capacity: 0/100
tasks: 0
systemd.unit.discovery: Returns JSON array of discovered units, usage: systemd.unit.discovery[<type>].
systemd.unit.info: Returns the unit info, usage: systemd.unit.info[unit,<parameter>,<interface>].

[TCP]
active: false
capacity: 0/100
tasks: 0
net.tcp.port: Checks if it is possible to make TCP connection to specified port.
net.tcp.service: Checks if service is running and accepting TCP connections.
net.tcp.service.perf: Checks performance of TCP service.

[UDP]
active: false
capacity: 0/100
tasks: 0
net.udp.service: Checks if service is running and responding to UDP requests.
net.udp.service.perf: Checks performance of UDP service.

[Uname]
active: true
capacity: 0/100
tasks: 0
system.hostname: Returns system host name.
system.sw.arch: Software architecture information.
system.uname: Returns system uname.

[Uptime]
active: false
capacity: 0/100
tasks: 0
system.uptime: Returns system uptime in seconds.

[VFSDev]
active: false
capacity: 0/100
tasks: 0
vfs.dev.discovery: List of block devices and their type. Used for low-level discovery.
vfs.dev.read: Disk read statistics.
vfs.dev.write: Disk write statistics.

[VfsFs]
active: false
capacity: 0/100
tasks: 0
vfs.fs.discovery: List of mounted filesystems. Used for low-level discovery.
vfs.fs.get: List of mounted filesystems with statistics.
vfs.fs.inode: Disk space in bytes or in percentage from total.
vfs.fs.size: Disk space in bytes or in percentage from total.

[Web]
active: false
capacity: 0/100
tasks: 0
web.page.get: Get content of a web page.
web.page.perf: Loading time of full web page (in seconds).
web.page.regexp: Find string on a web page.

[ZabbixAsync]
active: false
capacity: 0/100
tasks: 0
net.tcp.listen: Checks if this TCP port is in LISTEN state.
net.udp.listen: Checks if this UDP port is in LISTEN state.
sensor: Hardware sensor reading.
system.boottime: Returns system boot time.
system.cpu.intr: Device interrupts.
system.cpu.load: CPU load.
system.cpu.switches: Count of context switches.
system.hw.cpu: CPU information.
system.hw.macaddr: Listing of MAC addresses.
system.localtime: Returns system local time.
system.sw.os: Operating system information.
system.swap.in: Swap in (from device into memory) statistics.
system.swap.out: Swap out (from memory onto device) statistics.

[ZabbixStats]
active: false
capacity: 0/100
tasks: 0
zabbix.stats: Return a set of Zabbix server or proxy internal metrics or return number of monitored items in the queue which are delayed on Zabbix server or proxy.

[ZabbixSync]
active: false
capacity: 0/1
tasks: 0
net.dns: Checks if DNS service is up.
net.dns.record: Performs DNS query.
proc.mem: Memory used by process in bytes.
proc.num: The number of processes.
system.hw.chassis: Chassis information.
system.hw.devices: Listing of PCI or USB devices.
system.sw.packages: Listing of installed packages.
system.swap.size: Swap space size in bytes or in percentage from total.
system.users.num: Number of users logged in.
vfs.dir.count: Directory entry count.
vfs.dir.size: Directory size (in bytes).
vm.memory.size: Memory size in bytes or in percentage from total.
Windows 版
Zabbix Agent 2 [Windows host]. (5.0.3)
using configuration file: (省略)
ServerActive: 127.0.0.1
ListenPort: 10050

[Agent]
active: false
capacity: 0/100
tasks: 0
agent.hostname: Returns Hostname from agent configuration.
agent.ping: Returns agent availability check result.
agent.version: Version of Zabbix agent.

[Cpu]
active: false
capacity: 0/100
tasks: 0
system.cpu.discovery: List of detected CPUs/CPU cores, used for low-level discovery.
system.cpu.load: CPU load.
system.cpu.num: Number of CPUs.
system.cpu.util: CPU utilisation percentage.

[File]
active: false
capacity: 0/100
tasks: 0
vfs.file.cksum: Returns File checksum, calculated by the UNIX cksum algorithm.
vfs.file.contents: Retrieves contents of the file.
vfs.file.exists: Returns if file exists or not.
vfs.file.md5sum: Returns MD5 checksum of file.
vfs.file.regexp: Find string in a file.
vfs.file.regmatch: Find string in a file.
vfs.file.size: Returns file size.
vfs.file.time: Returns file time information.

[Log]
active: false
capacity: 0/100
tasks: 0
log: Log file monitoring.
log.count: Count of matched lines in log file monitoring.
logrt: Log file monitoring with log rotation support.
logrt.count: Count of matched lines in log file monitoring with log rotation support.

[Memory]
active: false
capacity: 0/100
tasks: 0
vm.memory.size: Returns memory size in bytes or in percentage from total.

[NetIf]
active: false
capacity: 0/100
tasks: 0
net.if.discovery: Returns list of network interfaces. Used for low-level discovery.
net.if.in: Returns incoming traffic statistics on network interface.
net.if.list: Returns a list of network interfaces in text format.
net.if.out: Returns outgoing traffic statistics on network interface.
net.if.total: Returns sum of incoming and outgoing traffic statistics on network interface.

[Postgres]
active: false
capacity: 0/100
tasks: 0
pgsql.archive: Returns info about size of archive files.
pgsql.autovacuum.count: Returns count of autovacuum workers.
pgsql.bgwriter: Returns JSON for sum of each type of bgwriter statistic.
pgsql.cache.hit: Returns cache hit percent.
pgsql.connections: Returns JSON for sum of each type of connection.
pgsql.db.age: Returns age for each database.
pgsql.db.bloating_tables: Returns percent of bloating tables for each database.
pgsql.db.discovery: Returns JSON discovery rule with names of databases.
pgsql.db.size: Returns size for each database.
pgsql.dbstat: Returns JSON for sum of each type of statistic.
pgsql.dbstat.sum: Returns JSON for sum of each type of statistic for all database.
pgsql.locks: Returns collect all metrics from pg_locks.
pgsql.oldest.xid: Returns age of oldest xid.
pgsql.ping: Test if connection is alive or not.
pgsql.replication.count: Returns number of standby servers.
pgsql.replication.lag.b: Returns replication lag with Master in byte.
pgsql.replication.lag.sec: Returns replication lag with Master in seconds.
pgsql.replication.master.discovery.application_name: Returns JSON discovery with application name from pg_stat_replication.
pgsql.replication.recovery_role: Returns postgreSQL recovery role.
pgsql.replication.status: Returns postgreSQL replication status.
pgsql.uptime: Returns uptime.
pgsql.wal.stat: Returns JSON wal by type.

[Proc]
active: false
capacity: 0/100
tasks: 0
proc.num: The number of processes.
proc_info: Various information about specific process(es).

[Redis]
active: false
capacity: 0/100
tasks: 0
redis.config: Returns configuration parameters of Redis server.
redis.info: Returns output of INFO command.
redis.ping: Test if connection is alive or not.
redis.slowlog.count: Returns the number of slow log entries since Redis has been started.

[Swap]
active: false
capacity: 0/100
tasks: 0
system.swap.size: Returns Swap space size in bytes or in percentage from total.

[SystemRun]
active: false
capacity: 0/100
tasks: 0
system.run: Run specified command.

[TCP]
active: false
capacity: 0/100
tasks: 0
net.tcp.listen: Checks if this TCP port is in LISTEN state.
net.tcp.port: Checks if it is possible to make TCP connection to specified port.
net.tcp.service: Checks if service is running and accepting TCP connections.
net.tcp.service.perf: Checks performance of TCP service.

[UDP]
active: false
capacity: 0/100
tasks: 0
net.udp.service: Checks if service is running and responding to UDP requests.
net.udp.service.perf: Checks performance of UDP service.

[Uname]
active: false
capacity: 0/100
tasks: 0
system.hostname: Returns system host name.
system.sw.arch: Software architecture information.
system.uname: Returns system uname.

[Uptime]
active: false
capacity: 0/100
tasks: 0
system.uptime: Returns system uptime in seconds.

[Users]
active: false
capacity: 0/100
tasks: 0
system.users.num: Returns number of useres logged in.

[VfsFs]
active: false
capacity: 0/100
tasks: 0
vfs.fs.discovery: List of mounted filesystems. Used for low-level discovery.
vfs.fs.get: List of mounted filesystems with statistics.
vfs.fs.size: Disk space in bytes or in percentage from total.

[Web]
active: false
capacity: 0/100
tasks: 0
web.page.get: Get content of a web page.
web.page.perf: Loading time of full web page (in seconds).
web.page.regexp: Find string on a web page.

[WindowsEventlog]
active: false
capacity: 0/100
tasks: 0
eventlog: Windows event log file monitoring.

[WindowsPerfInstance]
active: false
capacity: 0/1
tasks: 0
perf_instance.discovery: Get Windows performance instance object list.
perf_instance_en.discovery: Get Windows performance instance object English list.

[WindowsPerfMon]
active: false
capacity: 0/100
tasks: 0
perf_counter: Value of any Windows performance counter.
perf_counter_en: Value of any Windows performance counter in English.

[WindowsServices]
active: false
capacity: 0/100
tasks: 0
service.discovery: List of Windows services for low-level discovery.
service.info: Information about a service.
services: Filtered list of Windows sercices.

[Wmi]
active: false
capacity: 0/100
tasks: 0
wmi.get: Execute WMI query and return the first selected object.
wmi.getall: Execute WMI query and return the whole response converted in JSON format.

[ZabbixAsync]
active: false
capacity: 0/100
tasks: 0
system.localtime: Returns system local time.

[ZabbixStats]
active: false
capacity: 0/100
tasks: 0
zabbix.stats: Return a set of Zabbix server or proxy internal metrics or return number of monitored items in the queue which are delayed on Zabbix server or proxy.

[ZabbixSync]
active: false
capacity: 0/1
tasks: 0
net.dns: Checks if DNS service is up.
net.dns.record: Performs DNS query.
vfs.dir.count: Directory entry count.
vfs.dir.size: Directory size (in bytes).
まとめ
StatusPort を設定することで
- バージョン情報
- 利用している Plugin
- サポートされているアイテムキー
- Capacity
などが得られることを確認しました。
これにより、Zabbix で監視が正常に行えない場合、正常に起動しているか、そのアイテムキーがサポートされているか、Capacity が溢れていないか等を切り分けができるようになりました。
現状、Zabbix Server からはこの値はとれないようなので、今後使えるようになるとうれしいなと思います。